
We received our final electric bill for 2018 last week so it's time to summarize the 2018 energy use. The total energy use was 16,160 kWh (1,897 more than last year) at a cost of $1856 ( $140 more than last year).
The following chart shows the overall use by category.
The following chart shows the overall use by category.
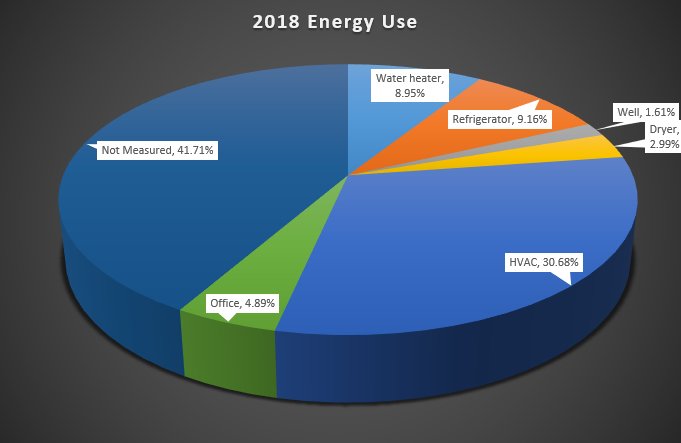
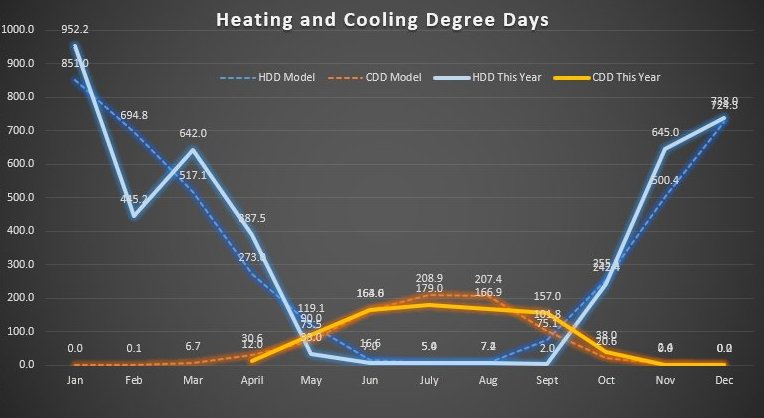
We used a total of 4980 kWh for HVAC (compared to 3882 last year). This was for a total of 4107 Heating Degree Days (HDD) compared to 3548 last year. In other words, the heating seasons were 16% colder but we used 28% more energy for heating and de-humidification.
The next chart shows the actual HDD and CDD for 2018 versus the historical model. February was much warmer while January, March and November were colder than average.
The next chart illustrates the energy consumed for heating. As in previous reports, the dashed grey line shows the theoretical energy used per Heating Degree Day (HDD) with no sun (i.e. a non-solar house). The dashed yellow line shows the theoretical energy use taking passive solar gain into account. In general we expect to receive about 30% of our heating load from the sun.
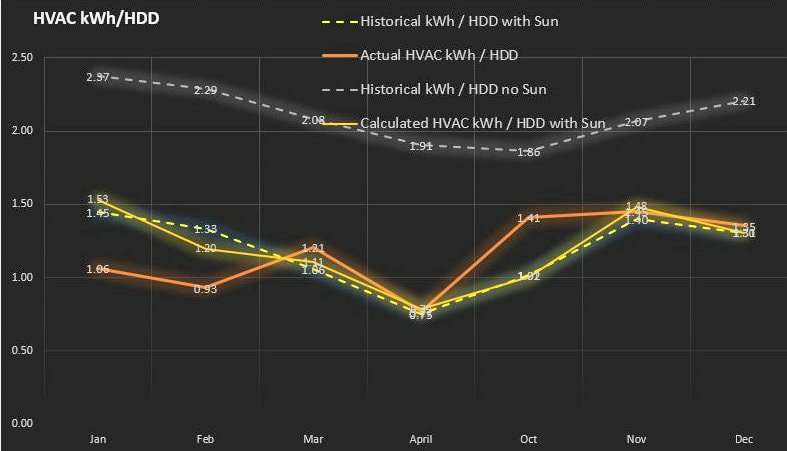
The solid orange line is the most important and shows the actual performance over the year. If the orange line is below the yellow line then the house is performing better than expected (i.e. it is using less energy than predicted).
The house did not perform as well as last year. I have no explanation for the particularly poor performance in October. In January and February I was using the wood stove to supplement the heat and the energy use was substantially less than the model. I used the stove very little in the other months because of the moderate temperatures.
Historical Perspective
To be noteworthy (or should I say "Magazine-worthy") a project needs to achieve net-zero which means that the house puts as much (or more) energy back into the grid as it consumes.
Georgia is a solar-unfriendly state. Net-zero would be economically impractical here so I decided that designing neoTerra to only consume 20% as much energy as the Chicago house would be a worthwhile and achievable goal.
Both houses have approximately the same amount of conditioned space so a direct comparison is fair. Note that Chicago is a 6000 HDD climate while North Georgia is only 4000 HDD. This means that roughly 33% of the savings in heat was achieved by merely by moving to a better climate.
That leaves about a 50% reduction that must be achieved through better design and construction.
The following chart shows energy use for a 4-year period in Chicago (2011-2014) followed by the subsequent 4-year period here at neoTerra. Note that Chicago utilized natural gas for heating, hot water and cooking so I have converted the electric consumption to equivalent BTUs.
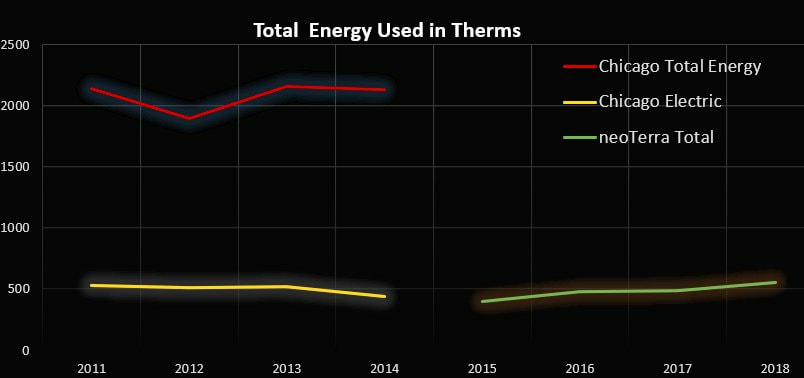
The average energy use in Chicago was 2078 Therms/year while the average for neoTerra is only 480. In short, the energy we consume here is only 23% of what we previously consumed. That's pretty close to the original goal of 20%.
 RSS Feed