
Wow, it's already March and I'm finally getting around to the 2016 Energy Report. So... here it is.
Background
First, for those of you just tuning in, the neoTerra project is our home and it is also a living experiment in sustainable design and energy efficiency. We strove to use durable, low-maintenance materials and we utilized recycled or recyclable materials wherever practical.
The house is all electric based on a philosophy that it will eventually be cost effective to produce our own electricity using solar panels but it will never be practical to make home-brew propane.
The house is a passive-solar design with an expectation that we will be able to receive 30% or more of our winter heating from the Sun. We use Diakin mini-split heat pumps for the remainder and we recently installed a high-efficiency wood stove to supplement the heat pumps and provide backup in the event of a power outage.
The house has roughly 4000 square feet of conditioned space (2000 on the main level shown below and 2000 in the basement level).
The house is located in the North Georgia mountains at an altitude of 2800 feet. The climate here averages about 8 - 10 degrees cooler than nearby Atlanta so heating is a larger factor than air conditioning.
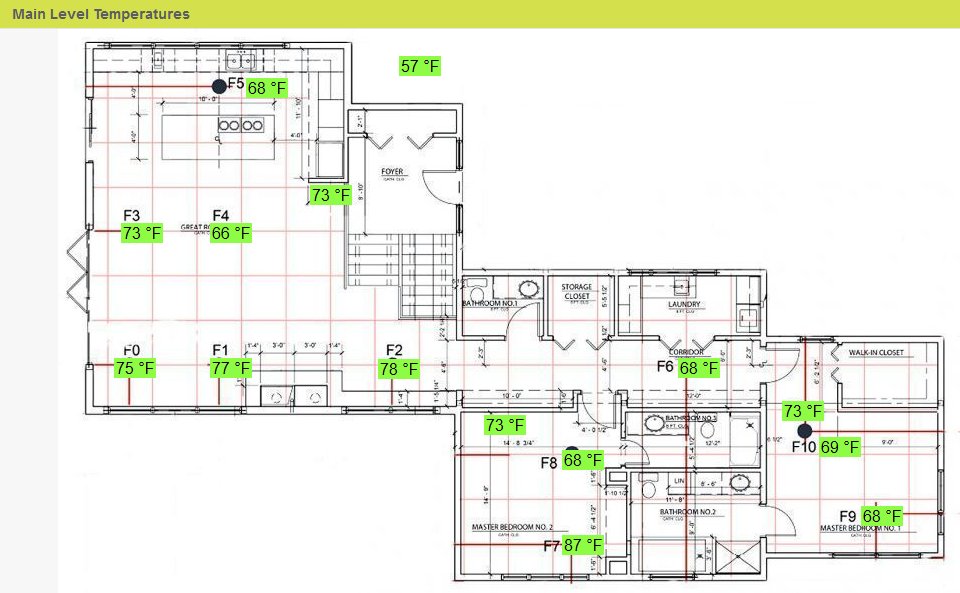
This is an engineering experiment of sorts and we installed an array of temperature sensors in the ceilings and floors to capture detailed data on the actual performance of the passive solar design.
As an example, the picture below shows the current, real-time temperatures on the main level. It's 4:00 on a bright, sunny day and the concrete floors receiving sun (i.e. to the south) are in the mid to upper 70's while the shaded areas are in the mid to upper 60's. The floor in the guest bedroom is at an amazing 87 degrees! This is free heat.
Background
First, for those of you just tuning in, the neoTerra project is our home and it is also a living experiment in sustainable design and energy efficiency. We strove to use durable, low-maintenance materials and we utilized recycled or recyclable materials wherever practical.
The house is all electric based on a philosophy that it will eventually be cost effective to produce our own electricity using solar panels but it will never be practical to make home-brew propane.
The house is a passive-solar design with an expectation that we will be able to receive 30% or more of our winter heating from the Sun. We use Diakin mini-split heat pumps for the remainder and we recently installed a high-efficiency wood stove to supplement the heat pumps and provide backup in the event of a power outage.
The house has roughly 4000 square feet of conditioned space (2000 on the main level shown below and 2000 in the basement level).
The house is located in the North Georgia mountains at an altitude of 2800 feet. The climate here averages about 8 - 10 degrees cooler than nearby Atlanta so heating is a larger factor than air conditioning.
This is an engineering experiment of sorts and we installed an array of temperature sensors in the ceilings and floors to capture detailed data on the actual performance of the passive solar design.
As an example, the picture below shows the current, real-time temperatures on the main level. It's 4:00 on a bright, sunny day and the concrete floors receiving sun (i.e. to the south) are in the mid to upper 70's while the shaded areas are in the mid to upper 60's. The floor in the guest bedroom is at an amazing 87 degrees! This is free heat.
I'll discuss the passive solar design in greater detail further down in this report.
2016 Energy Report
2016 Climate Data
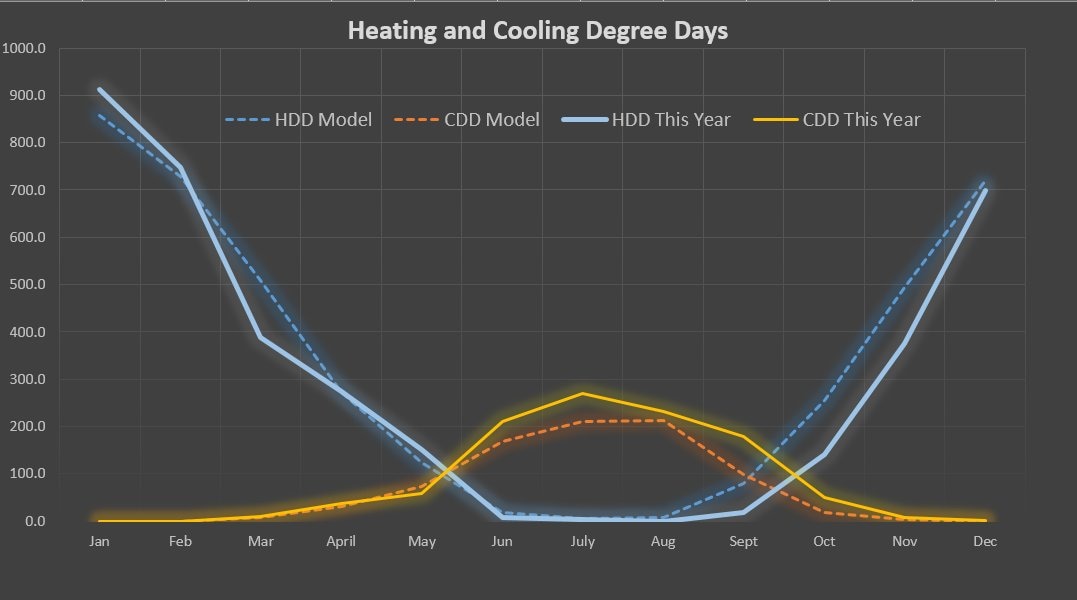
Since heating is our single largest use of energy it's important to consider the actual climate data for the year. Our historical average (14 years of data) is 4069 Heating Degree Days (HDD) and 825 Cooling Degree Days (CDD).
2016 started out close to the historical average with January slightly colder than normal and March slightly warmer. After that, we had the warmest summer on record and a mild winter. Overall, we accumulated 3717 HDD (9% warmer than average) and 1054 CDD (28% warmer than average).
The following chart shows the 2016 HDD, 2016 CDD and the respective historical averages. The dashed lines show the historical averages from our climate model and the solid lines show the actual data for 2016.
2016 Energy Use
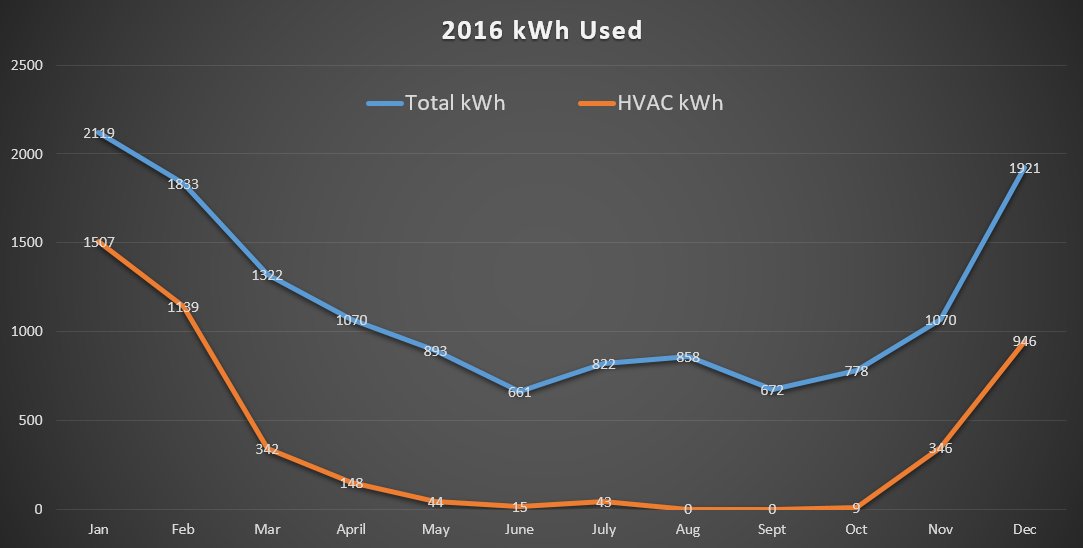
The next chart shows the total energy used as well as the amount used for heating and air conditioning. The total energy used was approximately 13000 kWh (about $1300.00) while the total for HVAC was 4539 kWh (approximately $450.00).
It's no surprise that we use a LOT more energy in the coldest months when we're heating and less in the warmer months.
The big surprise this year was how little we used for air conditioning. This was the warmest summer on record in Atlanta which is about 50 miles to our south. Good shade, cool mountain nights and superior insulation kept the house comfortable without AC. We ran the AC only four or five days and spent less than $20.00 on AC for the entire summer.
Heating a roughly 4000 square foot structure for $450 here in the mountains is very good and is actually better than what was predicted by the computer model used in designing the house.
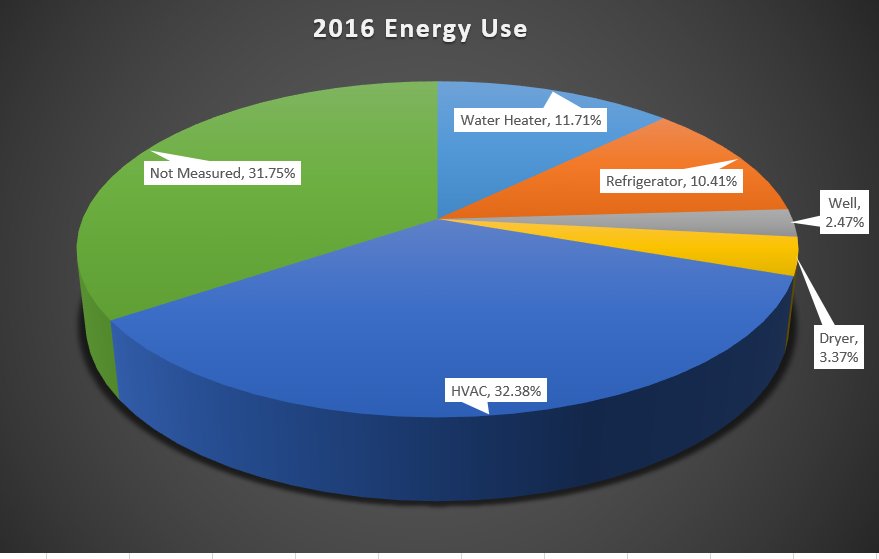
As detailed in earlier posts, we use a TED energy monitor to collect daily data on actual energy use. Overall, HVAC accounts for about 1/3 of our energy. The water heater and the refrigerator each consume about $11 / month while the well and electric dryer are almost insignificant.
About 1/3 of the energy consumed is not monitored. This includes cooking, lighting, TVs, computers and so forth.
Passive Solar Performance
The computer model we used while designing the house predicts the passive solar performance based on the following factors:
- Historical average HDD per month
- Historical average percentage of sunshine for each month
- The estimated heat pump efficiency based on the historical average temperature for the month
- The overall heat load of the entire house
The result is an estimate of the the total energy used (in kWh) per HDD. Lower numbers indicate better performance (i.e. less electricity consumed per HDD).
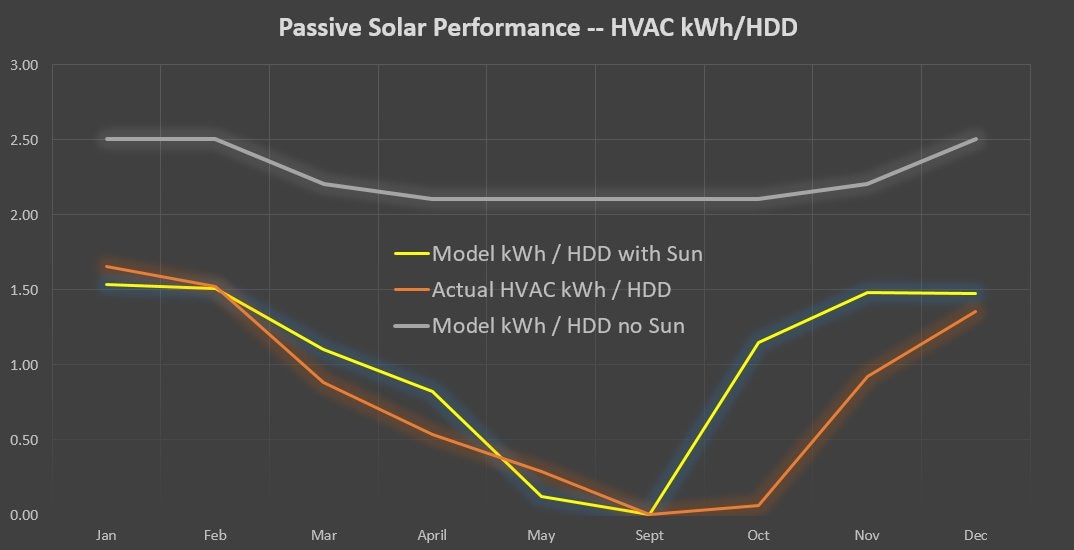
The following chart illustrates the results.
The upper gray line shows the amount of electricity that would be used if there was no solar input. In other words, this line is showing how a conventional house would perform. Note the results are a bit different for each month since the heat pumps are more efficient in the warmer months (March, April, November) and are less efficient in the colder months (Jan, Feb and Dec). The performance ranges from approximately 2.5 in the coldest months to about 2.1 in the more moderate months. Based on an average of 2.25 we would expect to spend approximately $900.00 on heat in an average winter.
The passive solar design model is shown by the yellow line. Heat from the sun pushes the performance to roughly 1.5 in the coldest (least efficient) months and achieves a factor of 1.0 or better in the more moderate months. Thus, the passive solar design reduces the predicted expense to $508.00, which is a reduction of better than 30%.
Finally, the orange line shows the actual performance for 2016. This must be analyzed in the context of the actual climate for 2016 shown earlier.
January 2016 was colder than average and the house performed slightly worse than the model (i.e. the orange line is above the yellow line).
February was almost exactly average and here the actual performance is almost perfectly aligned with the model.
March was somewhat warmer than average and the house performed better than the model.
In October and November the house performed much better than the model due to warmer temperatures and a prolonged drought that provided increased sunshine.
As mentioned earlier, the total heating expense for 2016 was only $450.00 which is 1/2 the cost for a similar sized non-passive design.
Conclusions
The results from 2016 show that the computer model is accurately predicting the performance of the passive solar design.
The model could be improved to model the actual year as it progresses rather than comparing against a historical model. This will be a project for 2017.
In 2016, the Sun delivered over 30% of our winter heat and the passive solar design saved approximately 3000 kWh of electricity.
 RSS Feed