This month I decided to look back over the entire heating season from November 1st 2015 through the end of January.
Intro
November and December were unusually mild with November at 411 HDD and December at only 431. January came in at 931 HDD which is just a bit colder than the 13 year average, so January provides a good representation of how the house performs under 'typical' winter conditions.
I've been working on the basement so we had heat on in the basement throughout the month. As I mentioned in the December report, heating the basement is a bad idea at this point since there are no walls yet and all the heat goes right up to the main floor. Nevertheless, I needed to stay comfortable so I kept the heat on.
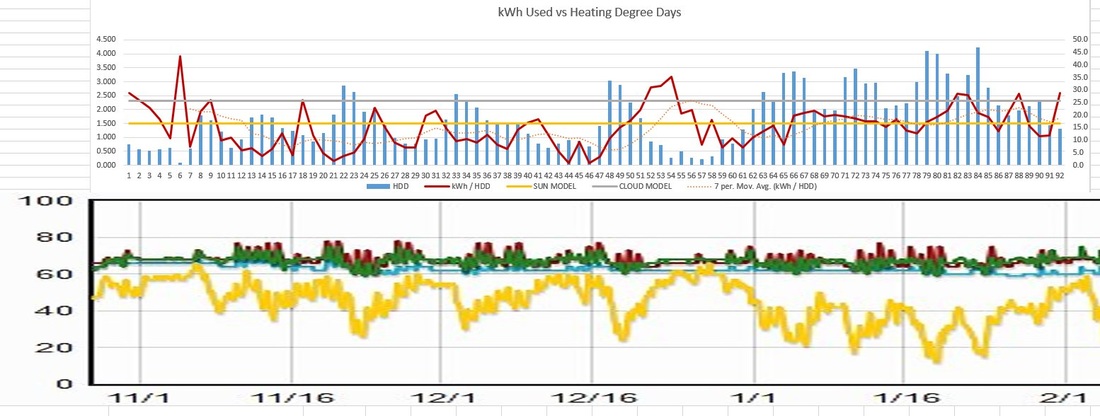
The two charts shown below show how the house has performed over the past three months. As a reminder, a Heating Degree Day (HDD) is a measure of how cold the weather was for a particular period of time. and a Kilowatt-Hour (kWh) is a measure of actual energy use.
In the upper chart I show HDD (the blue bars) versus kWh per HDD (the red line). Higher blue bars indicate colder temperatures.
The red line shows efficiency measured as HDD / kWh. A lower point on the red line indicates better efficiency while higher values indicate worse efficiency.
Before we built neoTerra we constructed a computer model to predict the efficiency. The gray bar (at 2.32 kWh/HDD) shows the predicted energy use on a cloudy day with no sun. The yellow line (at 1.5 kWh/HDD) shows the predicted efficiency for a month with average sunshine.
The bottom chart shows actual indoor and outdoor temperatures over the 92 day period for reference. (I would really like to get all this data in one chart but I haven't written the code to do that yet). The 'spiky' periods (on the green and red graphs) are days with sunshine where the floors got warm. The flat periods are days that were cloudy.
OK, if you got this far it means you've read through the boring stuff explaining the charts and you deserve a concise explanation.
Through November and December the house performed much better than the computer model predicted. The optimistic prediction (shown by the yellow line in the upper graph) is 1.32 kWh/HDD. Through November and most of December the house performed much better than the optimistic model; only going above the yellow line on a few occasions.
However, it would be incorrect to jump to conclusions for two reasons:
- November and December were unusually mild
- We were not heating the basement for most of this period.
January provides a perfect opportunity to evaluate the actual performance, Through January (including heating the basement level) the house performed within the predicted model. The performance was slightly worse than the model on a few cloudy days and slightly better than predicted on a few sunny days. But, overall, the performance was spot on.
Conclusions for January
The heating season isn't quite over yet but a few conclusions are in order.
The climate here in the North Georgia mountains is roughly 4000 HDD per year. At 1.5 kWh/HDD this amounts to a projected heating cost of about $600.00 per year, which is pretty darn good for a house with 4000 square feet under roof.
So far this heating season we have spent approximately $360.00 for heat (October through end of January). There are still two months to go but I'm fairly confident that the total will come in under $600.00.
Our worst single month of heating in Chicago was more than $600.00 and the average over 20 years was about $1200- $1400 per year using natural gas which is the absolute least expensive fuel. Heating with electricity would be unimaginable.
One of our goals for neoTerra was to build an all electric house. Someday it will become cost effective to produce our own electricity from the sun or wind but it will never be practical to make home-brew propane. Building an all electric house forces us to think about conservation, generation and self-sufficiency
The data so far indicates that we are receiving 30-40% of our heat through passive solar gain. In addition, the Daikin mini-splits appear to be delivering an efficiency of about 250% versus resistance heating. In combination, it means that it is possible to build a house that has large expanses of glass open to nature and which is still affordable to heat.
In February, we will have the basement heat turned off and see how it compares to January.


 RSS Feed