Fall 2017 Energy Use
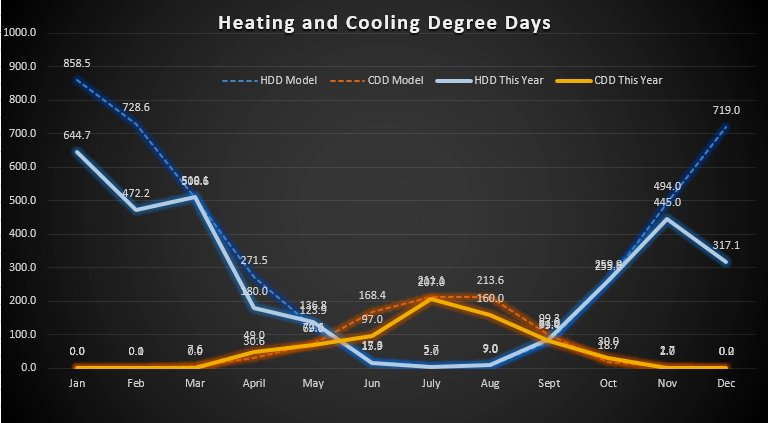
The first chart shows the Heating Degree Days this year compared to the historical average. October was almost perfectly average and November was slightly warmer than the historical model.
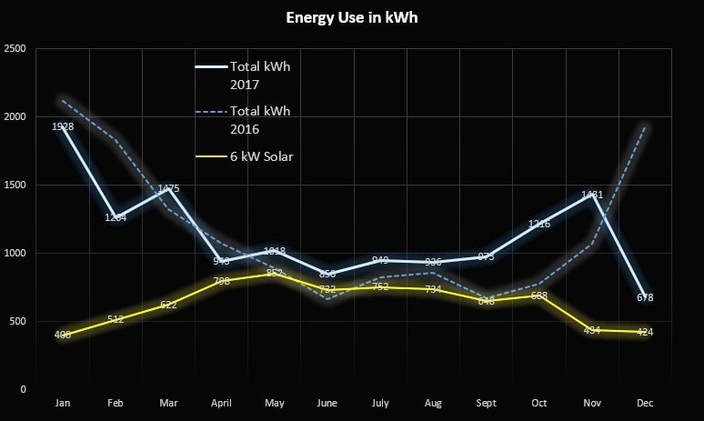
The second chart shows the actual energy use compared to last year. As mentioned in the previous report, we are using about 100 kWh ($10.00) more per month this year. Some of this increase is due to running dehumidification on the lower level and some is due to additional appliances, equipment and lighting.

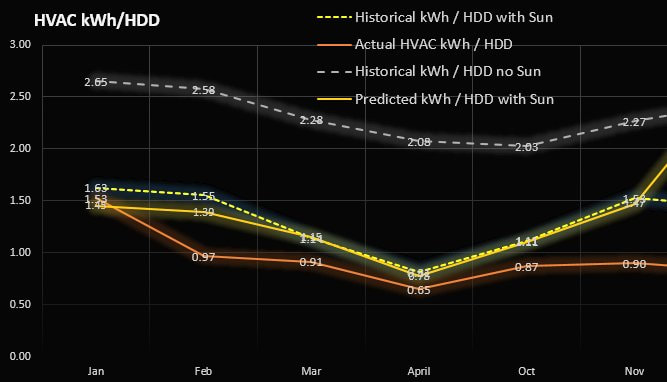
The third chart is the most important as it summarizes the heating energy efficiency.
As in previous reports, the dashed grey line indicates the theoretical efficiency with no solar energy based on the historical average temperatures for each month. The dashed yellow line shows the theoretical efficiency with solar gain. Recall that lower on the chart indicates better efficiency (i.e. less electricity used).
This month I have added a new element to the chart. The light orange line shows the theoretical efficiency (i.e. the computer model) based on the actual temperatures recorded for the month (rather than the historical average temperatures). In the future I may just remove the dashed yellow line since it isn't as useful as actual data.
The darker orange line shows the actual efficiency recorded for the month. Except for January, the house is performing better than the model. The heat pumps are probably operating a bit more efficiently than the values I used in the model. In March, April and October we were not using the wood stove so I plan to adjust the model to line up better with the actual results.

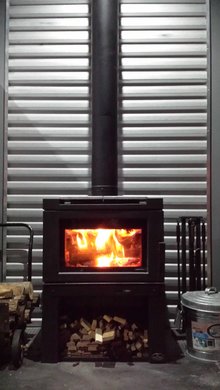
We installed a wood stove last December but didn't use it much. This winter I plan to burn two face cords of seasoned wood to get an idea of how much energy we can save.
A cord of wood is a stack that measures 8 feet wide by 4 feet high by 4 feet deep. Thus, it is approximately 128 cubic feet of wood.
Firewood is typically cut 16"-18" long so it will fit into a fireplace. A face cord is 8 feet wide by 4 feet tall but only one log deep. In other words, a face cord is 1/3 of a full cord (about 43 cubic feet).
The energy content of mixed hardwood is about 25,000,000 BTU per cord (i.e. 250 Therms). A high efficiency stove is about 80% efficient so we might expect to get about 200 Therms of heat from one cord.
Based on our computer model and two years of actual heating, the cost with the air heat pumps is $1.46 per therm.
Surprisingly, heating with wood is only slightly less expensive than running the heat pumps. Considering the inconvenience of stacking the wood, tending the fires and cleaning the stove, I probably would not use the stove if I had to pay for the wood.
However, we live on six wooded acres and get a fair amount of free wood from dead-fall and natural attrition. It will be interesting to see how much electricity can be saved using this free resource.


 RSS Feed