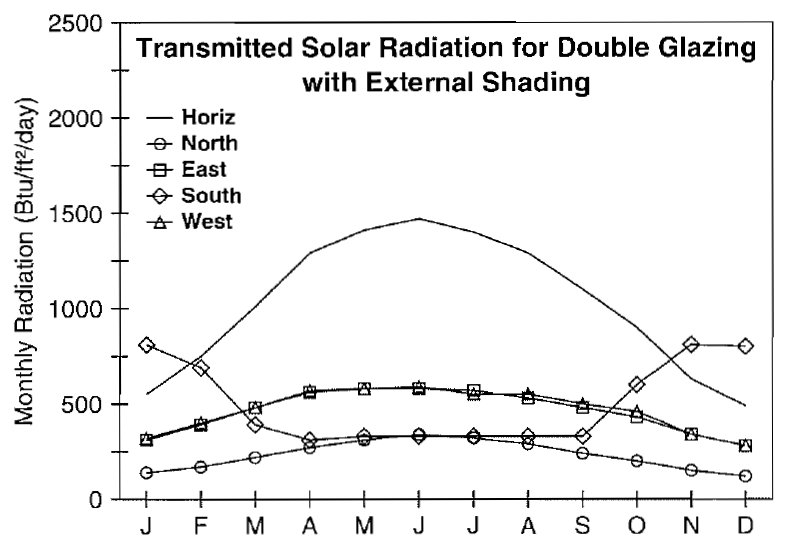
To estimate the potential heat gain, I started with the 1993 ASHRAE solar tables for 32 degrees north latitude, which is fairly close to our actual location. I got the tables from "The Passive Solar House", appendix 2 -table 14 and entered it all into an Excel spreadsheet. The following table shows the BTU's collected by 1 square foot of glass each day by month.
Note that this is calculated data based on an optimal perfectly clear sunny day.
However, most days are not perfectly sunny. Most days have some clouds, haze or overcast that diminishs the solar energy. To get a better estimate of actual solar gain, we can use data from NREL that estimates the average % of sunlight that is actually received each month in different cities. I used the % sunlight data for Atlanta to make the next table. This shows the BTUs per day adjusted for actual sunlight received. In general, the average amount of sunlight is only about half of the theoreticl optimal clear day.
One interesting note is that the Fall tends to get more clear days than the Winter, so November gets more actual sunlight than December or January.
This is summarized in a nice graph from NREL. The following chart shows the solar energy received for Athens, Ga.
The baseline design has about 475 square feet of south-facing glass. If we used perfectly clear glass then we might expect to collect about 400,000 BTUs on an average day from October through February. Unfortunately, a lot of that heat is blocked or lost by the glazing. In the next post we will look at the effect of the glazing Solar Heat Gain Coefficient (SHGC).


 RSS Feed