
Intro
Now that heating season has arrived, I'm planning to post a monthly energy report to summarize how the design is working.
November and the first half of December have been particularly mild this year so we can't tell how the house will perform when it gets really cold. However, with the temperature sensor array and the energy monitor it's possible to start making estimates.
Review
As a brief review, neoTerra is a passive solar design using Daikin multi-splits for HVAC. There are three independent mini-split systems with a total of seven interior units. These are:
Each of the three systems is independently monitored for energy use and data is collected each minute.
Now that heating season has arrived, I'm planning to post a monthly energy report to summarize how the design is working.
November and the first half of December have been particularly mild this year so we can't tell how the house will perform when it gets really cold. However, with the temperature sensor array and the energy monitor it's possible to start making estimates.
Review
As a brief review, neoTerra is a passive solar design using Daikin multi-splits for HVAC. There are three independent mini-split systems with a total of seven interior units. These are:
- HVAC WEST 2 interior units in the kitchen/great room
- HVAC EAST 1 interior unit in each of the two bedrooms
- HVAC BASE 3 interior units in the basement
Each of the three systems is independently monitored for energy use and data is collected each minute.
| In addition there is an array of digital temperature sensors embedded in the floors and ceilings. Right now, it looks like THIS >>>> Wow, it is 60 degrees out on December 16th. Nice! It's fairly sunny out and it's easy to see the effect of the sun on the slab. Areas in direct sunlight are at 73 - 78 degrees while areas that don't get sun are at 68. | 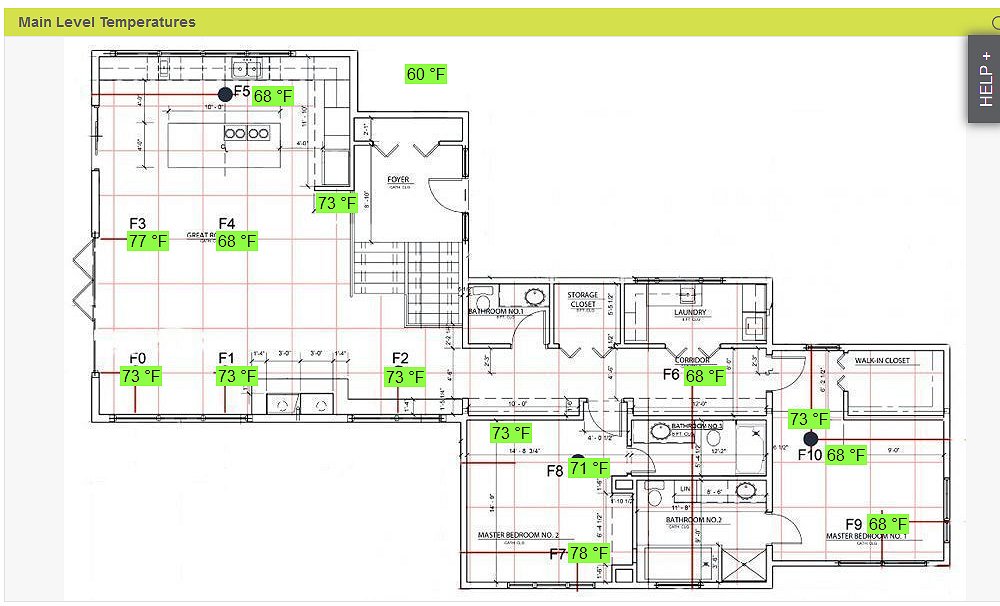 |
Before construction, we created a computer model of the house to estimate energy efficiency over a wide range of scenarios such as increasing or decreasing the amount of glazing, different levels of insulation, and different types of HVAC systems.
Of course a computer model is based on an endless number of assumptions. If any of the assumptions are incorrect then the model will make poor predictions of actual performance. One of the goals for this heating season is to refine the model and replace assumptions with actual data.
As an example, the computer model estimates that the heating load is approximately 15,816 BTU per Heating Degree Day. This is based on the amount of insulation and the estimated air infiltration. The actual heat load may be quite different based on how well the insulation was installed, and how wind speed might affect the rate of air infiltration (totally unknown).
In addition, the model assumed an average efficiency of 200% for the Daikin mini-splits but the actual efficiency varies with temperature. One of the goals for this heating season is to determine the actual efficiency at different temperatures and build that data into the next generation model.
November Report
November 2015 was a very moderate month. At 411 Heating Degree Days (HDD) it was only about 80% of the historical average for November. We used a total of 429 kWh of electricity for heating (about $43).
During most of this period only two of the seven internal units have been turned on. One unit in the kitchen and one unit in the master bedroom have supplied more than adequate heat for the entire house.
Since every month is different, the best way to view the HVAC energy use is to calculate the average energy (in kWh) versus the HDD. For November we averaged 1.04 kWh/HDD. This was a pleasant surprise since the computer model predicted 1.58 kWh/HDD.... in other words, the house performed about 50% better than the computer model predicted.
We had 15 straight days of rain between October 26th and November 9th. This is an absolute worst case scenario for a solar house. During this period the house used 2.03 kWh/HDD versus 2.32 predicted by the model for days without sun.
This is within about 10% of the model but it doesn't prove that the model is accurate. For example, an experiment a few weeks ago indicates that the Daikin units are actually operating at an efficiency higher than 200%. This implies that the heat load is greater than the model predicted. This doesn't surprise me since we keep the house at 68 degrees and the HDD calculations are based on an average of 65 degrees. The next generation model will utilize actual temperatures from the sensor array to calculate the heating load in real-time.
We had 5 sunny days between November 13th and November 17th. During this period the house averaged .61 kWh/HDD which is much better than predicted. Put another way, we averaged about 6 cents per HDD on sunny days versus 20 cents per HDD on days without sun.
Since the average for November was 1.04 kWh/HDD and the average for days without sun was 2.03, the sun provided almost 50% of our heat load in November in spite of 13 rain days. I'm pretty happy with that!
Well
We strongly considered rain water harvesting early in the design phase. Budget overruns made me defer the rainwater project.
We have been collecting energy data on the well over the past three months. During this time we have averaged about $21 per month to operate the well. September was more than October and November combined since we were landscaping and watering plants.
This really (pleasantly) surprised me since the well is 800 feet deep and I expected it to cost a lot more.
At this point I have decided to abandon plans for rainwater harvesting. It would cost almost $4000 to save about $10/month on energy. At that rate the project would take about 33 years to break even.
 RSS Feed