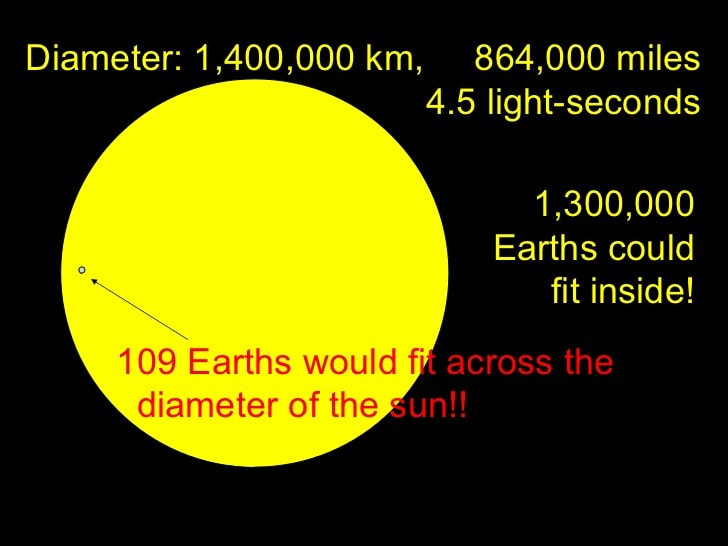
The Sun is absolutely HUGE. It is 1,300,000 times larger than Terra. In fact, most sunspots are bigger than our entire world! All energy on Terra comes from the Sun (with the exception of nuclear, tidal and geothermal, which are tiny contributions). I'll talk a lot more about energy in a future post.
It has been well proven that the energy from the sun fluctuates over various periods of time and that these fluctuations cause huge changes in our climate. It is absolutely proven that the Sun is producing more energy during periods with a lot of sunspots (which are gigantic storms on the Sun) and less energy during periods with few sunspots. This difference in energy is really small for the Sun but makes a BIG difference here on Terra.
- Sidebar – This does not mean that the sunspots create more energy… it is more likely that these solar storms occur because the Sun is producing more energy. The sunspots are merely an indicator and not a cause.
The evidence of this, which I will summarize below, is absolutely indisputable but is conveniently (and dishonestly) ignored by the Climate Hysterians.
Sunspot Cycles
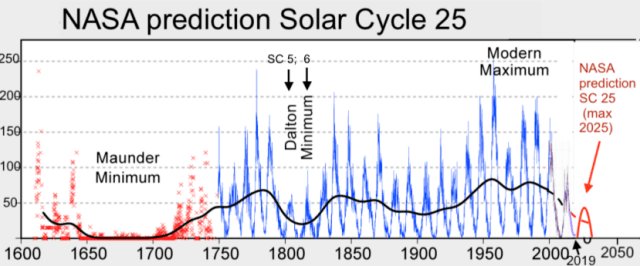
Astronomers (and Astrologers before them) began observing and recording sunspots in the 1600’s and accurate records have been kept since the mid-1700’s. The known sunspot record is shown in the picture below. Note that the early observations are shown in red and the accurate measurements (since 1750) are shown in blue.
Sunspots (and the energy from the Sun) have a very predictable 11-year cycle (as well as much longer cycles that are not well understood). We humans don’t notice the 11-year cycle but it is clearly reflected in tree rings which conclusively show greater growth in periods with more sunspots and slower growth in periods with fewer. This cycle is evident in the 11-year spikes and valleys in the chart below.
- Sidebar – The 11-year solar cycles are identified by sequence number starting in the early 1750’s with Solar Cycle 1 (SC1). A few cycles have been as short as 8 years and the longest was 14. Scientists define the start of a new cycle by the year when sunspots start increasing again. In short, each cycle starts at the bottom. Cycle 24 recently ended and we are now at the trough between SC24 - SC25.
The most important aspect is that there are much longer cycles when the spikes are MUCH higher indicating periods of greater heat from the Sun or much lower indicating less heat. These periods are referred to as ‘Minimums’ (few sunspots at the peak) and ‘Maximums’ (a lot of sunspots at the peak).
- Sidebar - Lows in 1800, 1910 and 2019 imply there is a longer cycle of roughly 105 - 110 years. However, the Maunder Minimum, which lasted more than 100 years casts some doubts on this pattern. In any case, the correlation between solar maximums/minimums and global warming/cooling is rock solid.
The Little Ice Age and the Maunder Minimum
The Little Ice Age, which devastated Europe (and other parts of Terra) with crop failures and famines (and wars), extended from roughly late-1500’s until the mid 1700’s. This exactly occurred during a 100-year period (called the Maunder Minimum) where sunspots were almost non-existent. There was a warming period in the late 1700’s (commented on by Thomas Jefferson) that corresponds to a resurgence in high sunspot activity that started around 1750 and began falling in the 1790’s. https://www.smithsonianmag.com/history/americas-first-great-global-warming-debate-31911494/
This 50-year warming trend was broken by another cold period that coincided with the Dalton Minimum, which again led to crop failures and famine but only lasted for 20-30 years. https://www.britannica.com/science/Little-Ice-Age
- Sidebar – Many scholars claim that 1853 is the end of the Little Ice Age because that is the last year that the River Thames in London froze over in the winter. In reality the Little Ice Age ended 100 years earlier but the warming trend was interrupted by the Dalton Minimum which caused much hardship
The 20th Century
Now, let’s investigate the alleged man-made global warming that has so many progressives in a state of fear and panic. I will do my best to present only FACTS.
I would like to call your attention to the period starting at about 1880 to 1910 when sunspot activity was relatively low but still well above the Dalton Minimum. From 1910 on sunspot activity steadily increased for over 50 years and the level in the late 1960’s was the highest ever recorded. The level from the 1970’s through 2000 continued to be MUCH higher than historical average.
This period (now called the “Modern Maximum”) has had the highest incidence of sunspots, and the greatest heat from the Sun in the past 400 years. It should be no surprise to any ‘climatologist’ that any ‘global warming’ that occurred during this period is due to the Sun.
It is utterly fraudulent to blame warming on CO2 when we have 400 years of concrete evidence that recent warming (past 90 years) is primarily caused by the Sun.
Since a peak in the mid-1990’s, sunspots have been diminishing and, coincidentally, Global Warming has taken a time-out. This led the climate fear-mongers to switch their battle-cry to “Climate Change”.
Over the last two years, sunspots have dropped to the lowest level since the Dalton Minimum in the early 1800’s. It is too early to predict another extended period of global cooling but it should clearly illustrate that CO2 is not the major factor in so-called “Climate Change”.
- Sidebar – The downward trend in sunspots starting in the late 1990’s is a concern because it resembles the downward trend at the start of the Dalton Minimum. However, keep in mind that the normal 11-year cycle has periods of two or three years with few sunspots. Terra is a big place and rides through these short periods without disastrous famines. It will take another several years (until SC25 peaks in 2025 or 2026) to determine if the current lull is an anomaly or the beginning of an extended cold period. DON’T PANIC … but you might want to hold on to that comfy down parka for awhile.
Conclusion
I have no doubt that CO2 is having some effect on climate. But it is not an existential threat to humanity… in fact it is probably a good thing because plants love CO2.
I like broccoli, so I like CO2 (clap, clap)
I like corn on the cob, so I like CO2 (clap, clap)
I like green beans and trees
… And birdies and bees
I like CO2 a lot and so should you (clap, clap)
Green Lives Matter! Free the Carbon-12 !


 RSS Feed